

OrcaCyber MiniMax M3.1 Flash: Six Readable Tails Out of Seven
Four thousand nine hundred forty-six milliseconds is the lowest p95 this card published in a week, and it published six readable ones. OrcaRouter reports both the median and the tail for each day. They sit on OrcaCyber MiniMax M3.1 Flash latency, and the second column is the one most cards in this tier leave blank.
The seven days
| date | p50 ms | p95 ms |
| 2026-11-14 | 1,727 | 6,562 |
| 2026-11-15 | 1,665 | 9,536 |
| 2026-11-16 | 1,891 | 9,102 |
| 2026-11-17 | 1,915 | 10,000 |
| 2026-11-18 | 1,590 | 4,946 |
| 2026-11-19 | 1,664 | 6,000 |
| 2026-11-20 | 1,715 | 4,714 |
Six days give a measurable p95 between 4,714 and 9,536; one day, the 17th, hits the cap. The weekly p95 of 7,747 sits inside that range.
That is a materially more informative week than most of the tier publishes. Four other cards cap their tail on six or seven days out of seven, and two of them never produce a readable figure at all.
| card | readable tails | capped days | p50 spread |
| Flash 1.0 | 7 | 0 | 1.57× |
| MiniMax M3.1 Flash | 6 | 1 | 1.20× |
| GLM 5.3 | 6 | 1 | 1.41× |
| K3.1 Pro | 5 | 2 | 1.83× |
| Hy4 | 4 | 3 | 1.09× |
| Zero 1.5 | 3 | 4 | 2.26× |
| Hy4 Flash | 2 | 1 | 1.33× |
| MiMo V2.6 Flash | 1 | 6 | 2.53× |
| Ultra 1.0 | 1 | 6 | 3.37× |
| GLM 5.3 Flash | 0 | 7 | 1.34× |
| Zero 1.0 | 0 | 7 | 3.08× |
Second-best in the tier on both the readable-tail count and the spread. That combination is the card’s most defensible published quality and it is not a performance claim at all — it is a measurement claim.
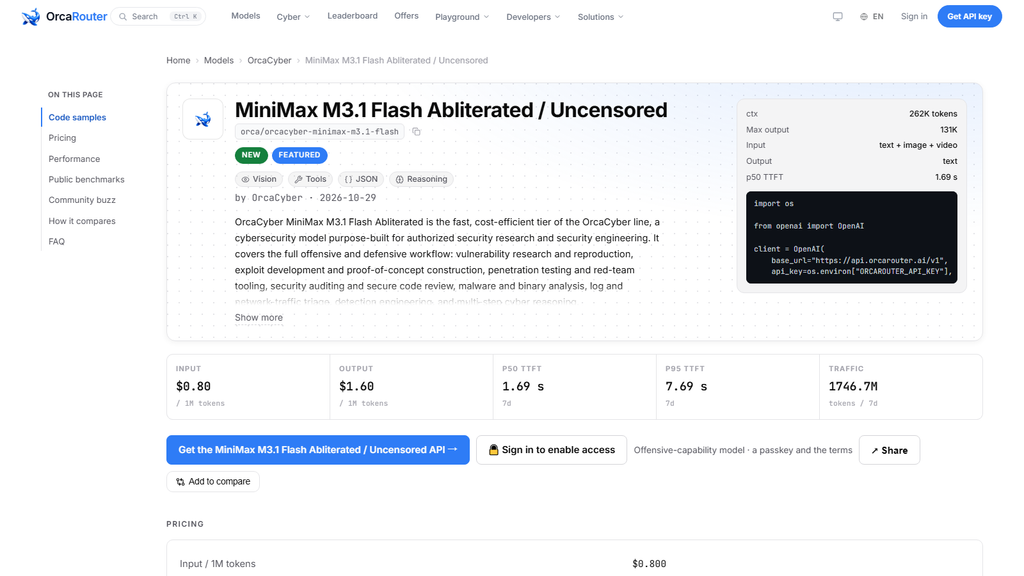

Why a measurable tail is worth more than a good one
A card with a tight, measurable tail lets a buyer set a timeout with arithmetic instead of faith. This card’s worst readable day is 9,536 ms and its best is 4,714, so a 10-second limit covers the published 95th percentile on every day observed.
Compare a card whose p95 is capped everywhere. The published value is a constant 10,000, which tells a buyer that at least 5% of requests exceeded ten seconds and nothing about by how much.
| timeout | this card, published coverage | capped card, coverage |
| 5 s | 95% on 2 of 6 days | unknown |
| 10 s | 95% on 6 of 6 days | 95% by definition, true value unknown |
| 30 s | 95% on 6 of 6 days | unknown |
The middle row is the interesting one. A 10-second timeout is provably adequate on every one of this card’s readable days, and it is a tautology on a capped card.
That difference is worth more than a lower median for a queue design. A queue that occasionally hits a 30-second request needs to know the rate at which that happens, and only a readable tail supplies it.
The tail against the median
The ratio of p95 to p50 is a dispersion measure the daily series makes computable.
| date | p50 | p95 | ratio |
| 11-14 | 1,727 | 6,562 | 3.80 |
| 11-15 | 1,665 | 9,536 | 5.73 |
| 11-16 | 1,891 | 9,102 | 4.81 |
| 11-18 | 1,590 | 4,946 | 3.11 |
| 11-19 | 1,664 | 6,000 | 3.61 |
| 11-20 | 1,715 | 4,714 | 2.75 |
Ratios between 2.75 and 5.73 on a median that barely moves. The dispersion is in the tail rather than in the typical call, which is the opposite of what Ultra 1.0 shows, where the median itself tripled.
A 5.73 ratio on the 15th means the 95th percentile was nearly six times the median — a wide day with a normal centre. That is the shape of a card serving mostly-fast calls with a genuine long tail behind them.
For a queue this is the useful case. The median says most jobs finish in under two seconds and the tail says one in twenty takes nine. Both figures inform capacity, and both are published.
What the week’s numbers add up to
| quantity | value |
| 7-day tokens | 1.71 B |
| 7-day bill | $1,710 |
| blend | $1.0000 |
| error rate | 0.18 % |
| failed tokens | 3.1 M |
| failed cost per billion | $1,794 |
| $/M/s | $0.01450 |
| ceiling fill | 19.8 min |
| readable tail days | 6 of 7 |
Nothing in this row is the best or worst in the tier. That is the point: the card is mid-priced, mid-fast, mid-volume, with a mid error rate — and its one distinguishing published property is that its telemetry can be read.
For a buyer weighing several band-priced cards, that is a tiebreaker worth using. Five other cards share the $0.80/$1.60 row, and this is the one whose seven-day series supports a timeout calculation rather than a guess.
The card’s ceiling run of 19.8 minutes is the practical limit on the other side. At 110.3 tokens a second, a maximum-length answer takes twenty minutes, so a queue needs a timeout above that for ceiling-length jobs even though the first token arrives in under two seconds.
What the tail-to-median ratio says about capacity
A p95 five times the median describes a queue with a long service tail, and the daily series makes that ratio computable for six days.
| card | median p95/p50 ratio | capped days |
| MiniMax M3.1 Flash | ~4.0 | 1 |
| Flash 1.0 | ~6.0 | 0 |
| K3.1 Pro | ~6.1 | 2 |
| Hy4 | ~2.5 | 3 |
| GLM 5.3 | ~2.7 | 1 |
This card’s ratio sits in the middle and its readability is what makes the calculation possible at all. Four cards in the tier cannot be placed in this table because their tails are mostly or entirely capped.
For capacity planning the ratio is the number that decides headroom. A 4× ratio means provisioning for the 95th percentile rather than the median, and a 6× ratio means quite a lot more.
The card’s own ratio varies from 2.75 to 5.73 across the six readable days, which is wider than its median varies by a factor of four. So the tail is the unstable quantity, and it is the one a queue sizes against.
That is the same asymmetry Hy4 shows, at a different level: the median is what a card looks like and the tail is what it costs to run.
A last caveat applies to the coverage table itself. It counts days on which the published p95 is below 10,000 milliseconds, which is a property of the measurement rather than of the card’s reliability. A card that never exceeds five seconds and a card that exceeds it on one day in seven both produce readable figures, and the table cannot separate them; the p95 column can, which is why the two are worth reading together rather than in isolation.
The card therefore supports a timeout decision that most of the tier does not: a limit can be chosen from the published series rather than guessed, and the error from choosing wrongly is measurable rather than silent.
OrcaCyber MiniMax M3.1 Flash published six readable daily p95 figures between 4,714 and 9,536 milliseconds, with only one capped day — second-best in the tier on readable tails and second-tightest on median spread at 1.20×.
A tight median over a measurable tail lets a 10-second timeout be justified by arithmetic rather than faith, which most of the tier’s cards cannot support. The card is otherwise mid-priced and mid-fast at $0.01450 per million per second, with a 19.8-minute ceiling run.
Sourcing note: the seven-day daily p50 and p95 series, weekly percentiles, throughput, error rate, price rows, cache rate, ceiling, token volume and benchmark rows are read from the OrcaCyber MiniMax M3.1 Flash model API and card page on orcarouter.ai on 2026-11-20, with latency, throughput and error rates being OrcaRouter production telemetry for 2026-11-14 to 2026-11-20. The spreads, tail-to-median ratios, coverage table and failure arithmetic are our own arithmetic. A p95 reading of exactly 10,000 ms is the reporting cap, not a measurement. No competitor product is named or compared. Checked 2026-11-20.